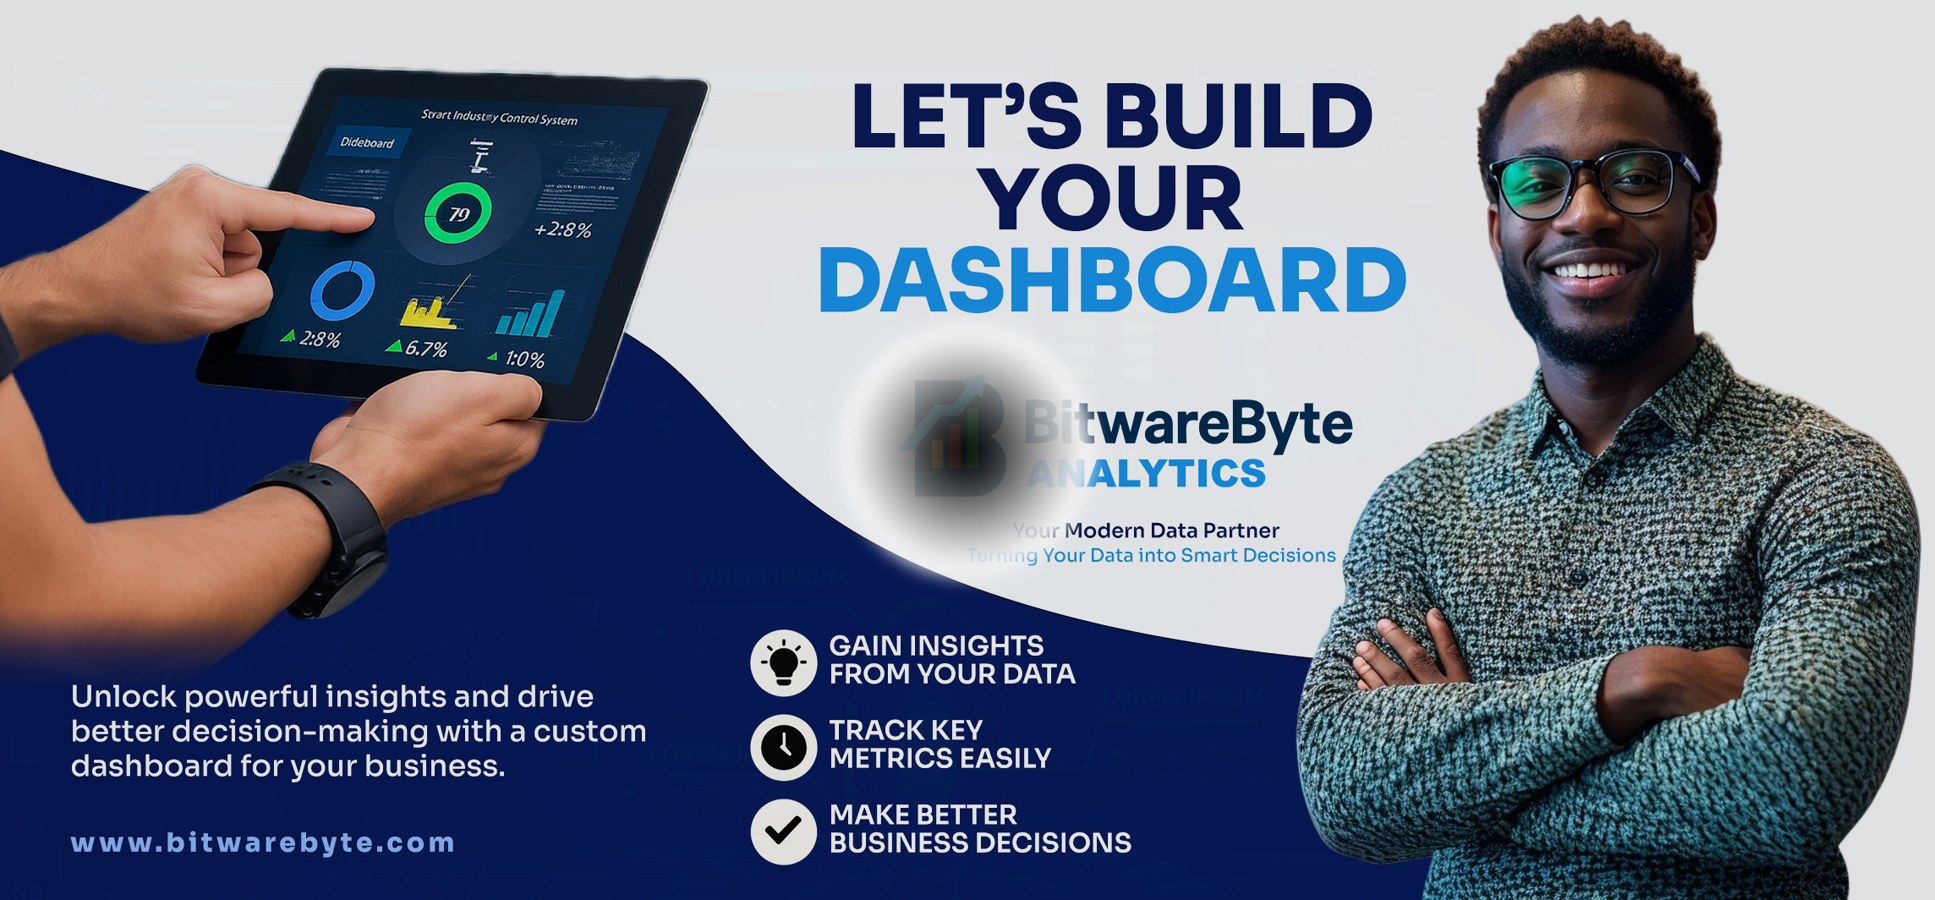
Business Intelligence & Dashboarding
Visualize What Matters Most
At BitwareByte Analytics, our Business Intelligence & Dashboarding service turns raw data into powerful, interactive visuals that give you clarity at a glance.
Whether you’re tracking sales, monitoring operations, or aligning teams around strategic KPIs, our dashboards are tailored to fit your business goals and speak your language.
No clutter. No guesswork. Just the right insights — when and where you need them.
Our BI & Dashboarding Workflow
01
Define KPIs & Business Goals
We work with you to identify what matters most and which metrics drive results.
02
Connect & Structure Your Data
We integrate, clean, and model data from your key systems to ensure accuracy and consistency.
03
Design Insightful Dashboards
Our team creates intuitive dashboards using Power BI, Tableau, or your preferred tools.
04
Deploy & Train Your Team
We launch your dashboards with documentation and hands-on training for your teams.
What You’ll Gain
Unlock the true potential of your data with dashboards that drive action and foster alignment across your organization. With our BI solutions, you’ll gain:
- Real-time visibility into performance
- Executive and team-level decision support
- Data alignment across departments
- Automated reporting & alerts
- Time savings through centralized views
- Enhanced accountability and transparency
Ready to Build Dashboards That Drive Results?
Let’s help you put your data to work with dynamic, decision-ready dashboards that elevate your performance.


